Hey, Francis here with yet another daily scribe posting! Today, we had it easy. There was a substitute teacher because Mr. Kuropatwa was doing another speech, that ever so smart teacher of ours (I bet he's blushing as he reads this).
Today our class was located in the library because painters overrun our classroom. We were told to relocate to room 14, but NO! Mr. May was in there teaching his class because his classroom was also overrun by painters! After all this confusion we decided to stay in the library.
First off, we were given a quiz on plotting functions. Such as transforming, stretching and flipping functions. The quiz wasn't incredibly long, and I found it quite simple (unless of course I failed it). After finishing the quiz we were told to work on exercise 12 for the rest of the morning period.
The afternoon period wasn't bad either. We were given a worksheet to finish in class as a review. It was about analyzing the functions and describing a given function's appearance. Today's homework will be exercise 12. Today's pre-cal experience was a simple one, and quite different due to the confusion of our class location at first. All in all, it was another great learning experience.
The next scribe for tomarrow, which is the 7th day of the 3rd month of the year 2008 for the 1st period which is 9:00am-10:04am will be JamieNeRd123C.
Thursday, March 6, 2008

Wednesday, March 5, 2008
March 5 2008: Workshop Class
Hi guy if you don't know me by now my name is Richard and i will be your scribe for today since Justus picked me when yesterday he said Francis was going to be scribe anyways..
Today's class started off a little different because when i walked in Mr K. was playing some Michael Bubble. And also today's was was a work shop class. For those people that don't know what a work shop class is, it is class where we are divided up into groups and are given question. it is sort of a race so the groups are competing against each other.
The First question on slide 2 and 3 was a bit confusing some groups got it to be an even function and some groups thought that the function was neither even or odd. The right answer was that function is really even which Kristina's group got right. Well you ask why is it even? it is even because the function f(x) = x - x^2 is equal to f(-x) = x - x^2.
The second question was quite simply. But Francis's group beat Benchmen's group to putting the answer on the smart board. if you are having trouble on this question Justus's scribe post will help you alot.
Today we also learned how to sketch the graphs of absolute value functions.
Well if you dont know the formal way of describing absolut values is
-if the x value is greater than or equal to zero then the x value is a positve and if the x value is less then zero the x value is negative.
Well anyways back to learning how to sketch the graphs of absolute value functions.
The first step is to sketch the graph of the value without the ablsolute value an example would be f(x) = x ------> f(x) = x
The next step would be to reflect the line that is below the x- axis over the x-axis.
Congratulations you now know how to sketch absolute value functions you deserve to give yourself a pat on the back.
The third question is some practice for you on how to sketch the graphs of absolute value functions. : f(x) = x^2-4 sort of looks like batman which is probably why Mr. K Said that this is one of his favorite function.
And finally the last question was a bit tricky well for me it was. We sort of ran out of time so Mr. K solved the question for us.
Well if you missed it homework for tonight is exercise 11 and don't forget to make a Delicious account it you forgot the link her it is http://del.icio.us/ you also have to find one link that you found helpful for your knowledge for the unit circular functions. The Scribe is going to be the first person on the scribe list which is The Scribe List ha ha . Francis
Today's class started off a little different because when i walked in Mr K. was playing some Michael Bubble. And also today's was was a work shop class. For those people that don't know what a work shop class is, it is class where we are divided up into groups and are given question. it is sort of a race so the groups are competing against each other.
The First question on slide 2 and 3 was a bit confusing some groups got it to be an even function and some groups thought that the function was neither even or odd. The right answer was that function is really even which Kristina's group got right. Well you ask why is it even? it is even because the function f(x) = x - x^2 is equal to f(-x) = x - x^2.
The second question was quite simply. But Francis's group beat Benchmen's group to putting the answer on the smart board. if you are having trouble on this question Justus's scribe post will help you alot.
Today we also learned how to sketch the graphs of absolute value functions.
Well if you dont know the formal way of describing absolut values is
-if the x value is greater than or equal to zero then the x value is a positve and if the x value is less then zero the x value is negative.
Well anyways back to learning how to sketch the graphs of absolute value functions.
The first step is to sketch the graph of the value without the ablsolute value an example would be f(x) = x ------> f(x) = x
The next step would be to reflect the line that is below the x- axis over the x-axis.
Congratulations you now know how to sketch absolute value functions you deserve to give yourself a pat on the back.
The third question is some practice for you on how to sketch the graphs of absolute value functions. : f(x) = x^2-4 sort of looks like batman which is probably why Mr. K Said that this is one of his favorite function.
And finally the last question was a bit tricky well for me it was. We sort of ran out of time so Mr. K solved the question for us.
Well if you missed it homework for tonight is exercise 11 and don't forget to make a Delicious account it you forgot the link her it is http://del.icio.us/ you also have to find one link that you found helpful for your knowledge for the unit circular functions. The Scribe is going to be the first person on the scribe list which is The Scribe List ha ha . Francis

Tuesday, March 4, 2008
Reciprocals; the Mathematical Flip
Well hello again, it's me Justus, being that thing called scribe again (thanks to Benofschool >_<;). Anyways lets get this show on the road, as I haven't got much time until my basketball practice -_-; *Note* Sorry this was put out so late guys, I tried to get it done before I had to leave for my practice, but I ended up falling just short and having to finish it, well, now, once I got home. So yeah, I apologize for that. >.<; So onward! Mr.K started off the period by finishing up and reviewing the inverse function work/question we had from yesterdays class. That question can be seen on the first slide (not including the cover slide with the skater on the front.) To solve these questions (as seen on the slide) we began by graphing the original function, f(x) = √(x+9) -2. Now because some people weren't quite sure what the graph of √x looked like. Mr. K went over it and some of its properties with us. First he mentioned that the graph of √x looks like a parabola rotated -pi/2 radians (or flipped on its side, opening to the right). He also mentioned that the graph of √x is split into two parts, the top half (also known as the principle function) and the bottom half. This division of the graph occurs because of the fact that a square root may be positive or negative. The bottom half of the graph comes from the possible - value of the square root. Thus, the graph on the slide, only looks like half the parabola. After going over that, and having Francis write what he got as the Inverse function on the Smart Board, Mr.K quickly went over the rest of the answers for the questions.
Things to Remember from this opening rant/the opening minutes of class
- The graph of √x looks like a parabola on it's side, opening left, minus the bottom half
- -b/2a is the x coordinate of the vertex
- The X intercept of the inverse functions graph, equals the Y intercept of the original functions graph.
- The Inverse graph should reflect along the line y=x
- And finally, Inverse undoes what the original function does AND THAT'S ALL (hence why on the slide (#3), there is a piece of the inverse graph is marked out in green.)
SO. After finishing that kinda longish review of yesterdays opening mind bender we started today's lesson, involving reciprocals. Our opening slide had two sets of numbers, the first going 1, 2, 4, 10, 100, 1 000, 1 000 000, and the second going, 1, 0.5, 0.25, 0.1, 0.01, 0.001, 0.000 001. The text at the top of this slide, read, "Find the reciprocal of each of these numbers. If it is a decimal number, convert it to a fraction first. Now we all know from previous mathematics courses, that the reciprocal of any number, is simply the fractional form of that number, "flipped." That is to say, the numerator and denominator have switched places so that the denominator is now the numerator and vice versa. (ex. for the fraction, 3/8 the reciprocal would be, 8/3. The reciprocal of the number 5, would be 1/5.) By now we had realized that the relationship between to two sets of numbers was obvious, they were in fact reciprocals of each other. However this wasn't the point, the point my friends, I am about to reveal to you, so pay attention. The main point of writing those numbers, and finding their reciprocals (as seen on the slide), was so that we'd understand the following.
As the original numbers get larger, their RECIPROCALS get smaller.
OR as the reciprocal of a number gets larger, the original value of said number gets smaller.
(*note* the terms biggering and smallering are suitable for use in these statements, as replacements for the phrases, "getting bigger, and getting smaller")
In case you were wondering about negative numbers fear not, Mr. K had thought of that too, and had coined a term specifically for this. In the instance of negative values (-1, -2, -4, -10, etc...) their reciprocal values are said to be Biggering Negatively (notice the reciprocal values here are -1, -1/2, -1/4, -1/10, which are all larger then their reciprocal cousins, as they are closer to/moving towards "0"). It should also be mentioned that the reverse case is also true, should the values be moving towards 0, their reciprocals would be, "Smallering Negatively" as seen in the following case (-1, -1/2, -1/4, -1/10 reciprocal values are, -1, -2, -4, -10 respectively)
Mr. K said that if you understood these concepts, then you understood the lesson for today.
So equipped with our new found knowledge we set off to graph these things called reciprocals. To do this we started off as follows.
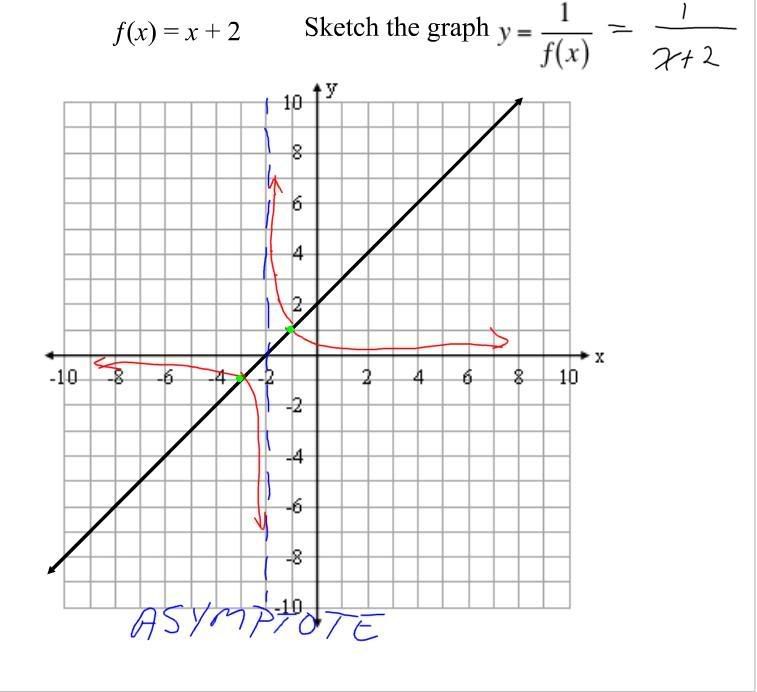
"Taking the graph of x+2, graph 1/f(x)"
At first, these appeared to be a daunting task, I mean, telling someone the reciprocal was one thing, but graphing it? A whole 'nother matter indeed. However Mr. K once again came to our rescue and showed us a couple of steps to aid us in our reciprocal graphing woes.
Step.1) Graph the original function.
- Now this may seem like kind of a no-brainer, but in the second example we received we saw that we would not always be giving the original function first, and would have to figure out what it was first, THEN graph it, THEN move on to the next step.
Step.2) Find every point on the original graph where y= ±1.
- This step is necessary because as we found in our numbers (shown above starting with 1 and ending with 1 000 000) the reciprocal of 1 is always 1, and the reciprocal of -1 is always -1. THUS, these points will always be on the reciprocal graphs. *note* These points are called Invariant Points
*Vocabulary Skill + 5!*
Step 3.) Look at where your original graph has roots.
-This step is necessary because where ever your original graph has roots, the reciprocal graph will have an asymptote, due to the fact that the reciprocal of 0 is undefined.
Step 4.) Now the final piece of the puzzle, putting it all together and drawing/sketching out the reciprocal graph. To do this, we must simply follow what we found out before about reciprocals. When the original value is biggering, the reciprocal value is smallering. Keeping this in mind, we may begin construction of the line. To do this, look at the line of the graph, and see which direction it's going. For example, looking at the graph of X+2, and it's reciprocal, 1/X+2
Click here for the graph!
So looking at the graph you should notice the two green dots. Those are out invariant points, and it is from these that we will be working. Since it's normally a good idea to start with the extremes and work from there, that's what we'll be doing today.
*note* when doing these, you'll determine the graph direction by going towards the asymptotes. This may make more sense in a moment.
So starting at the point (-1,1) and working towards the asymptote, we find the graph smallering. Thus by our "mantra" so to speak, we know that the reciprocal graph line, must be biggering. Thus we draw our first point. Next we go to the other extreme, at the point (-3, -1). here, the graphs behaviour towards the asymptote is to smaller negatively (which is technically biggering.) Thus, the reciprocal line graph must bigger negatively (which is thus smallering.) Finally we are left to do the final lines, those not seen on the extremes, the ones curving up vertically, near the asymptote. Much like the previous ones, the solution lies in the biggering and smallering, using the invariant points as our start point. Looking at the graph from the green point and going towards the asymptote, we see that it is still smallering, and thus the reciprocal line much be biggering, this time, up the y axis. The same is true for the other point, except it is biggering negatively, as it is in "quad 3" and thus negative in value.
I think this for the most part concludes this blog entry. There is one more thing though, as we put together another graph in our examples.
Click Here for the Second Graph!
Plotting the reciprocal graph for this function was the same as the other, except there were two asymptotes instead of one. Following the steps you may eventually come to a point where your wondering what to do with the vertex of this graph. Because it is a y intercept, you can figure out where it will be on the y-axis in the reciprocal graph (in this case the y intercept is at -4, so the reciprocal point is at -1/4) Since this is a smooth graph, all that remains to be done is join the point at (0, -1/4) to the rest of the graph. In the image above, this step is colored in orange (sorry if it's hard to see). So yes, the part everyone usually scrolls down the whole thing to see, whose the next scribe -_-;
Alright, I believe that really and truly raps it up for today.Again I'm sorry the blog came out late, and maybe slightly all over the place. Hopefully its understandable, cause this is basically how I interpreted the lesson, and I've been told my way of doing things is a little bit weird at times :p If anyone has any questions about my post, or needs me to clarify something, feel free to post it. Also if anyone has anything to add, or knows I forgot something, feel free to tell me (and PLEASE DO TELL ME) so that I can fix it, or add it in or whatever. Also on the flip side if you feel so inclined you can add it in yourself :p
Well since I'm too tired to make a big huge crazy skill testing question to decipher to find out who the next scribe is, I'll probably just come out and tell you it's Richard. Kinda like how I just did...
OH also, homework was exercise #10, for anyone who missed that.
One more thing, don't forget about Mr.K lying during class :p It seems to me we've forgotten about it already! Lets be sure to catch him in the act tomorrow eh? :D
Finally, the word you've all been waiting for.
http://www.merriam-webster.com/dictionary/infinitesimally
REMEMBER! When A number is biggering, it's reciprocal is smallering!
Things to Remember from this opening rant/the opening minutes of class
- The graph of √x looks like a parabola on it's side, opening left, minus the bottom half
- -b/2a is the x coordinate of the vertex
- The X intercept of the inverse functions graph, equals the Y intercept of the original functions graph.
- The Inverse graph should reflect along the line y=x
- And finally, Inverse undoes what the original function does AND THAT'S ALL (hence why on the slide (#3), there is a piece of the inverse graph is marked out in green.)
SO. After finishing that kinda longish review of yesterdays opening mind bender we started today's lesson, involving reciprocals. Our opening slide had two sets of numbers, the first going 1, 2, 4, 10, 100, 1 000, 1 000 000, and the second going, 1, 0.5, 0.25, 0.1, 0.01, 0.001, 0.000 001. The text at the top of this slide, read, "Find the reciprocal of each of these numbers. If it is a decimal number, convert it to a fraction first. Now we all know from previous mathematics courses, that the reciprocal of any number, is simply the fractional form of that number, "flipped." That is to say, the numerator and denominator have switched places so that the denominator is now the numerator and vice versa. (ex. for the fraction, 3/8 the reciprocal would be, 8/3. The reciprocal of the number 5, would be 1/5.) By now we had realized that the relationship between to two sets of numbers was obvious, they were in fact reciprocals of each other. However this wasn't the point, the point my friends, I am about to reveal to you, so pay attention. The main point of writing those numbers, and finding their reciprocals (as seen on the slide), was so that we'd understand the following.
As the original numbers get larger, their RECIPROCALS get smaller.
OR as the reciprocal of a number gets larger, the original value of said number gets smaller.
(*note* the terms biggering and smallering are suitable for use in these statements, as replacements for the phrases, "getting bigger, and getting smaller")
In case you were wondering about negative numbers fear not, Mr. K had thought of that too, and had coined a term specifically for this. In the instance of negative values (-1, -2, -4, -10, etc...) their reciprocal values are said to be Biggering Negatively (notice the reciprocal values here are -1, -1/2, -1/4, -1/10, which are all larger then their reciprocal cousins, as they are closer to/moving towards "0"). It should also be mentioned that the reverse case is also true, should the values be moving towards 0, their reciprocals would be, "Smallering Negatively" as seen in the following case (-1, -1/2, -1/4, -1/10 reciprocal values are, -1, -2, -4, -10 respectively)
Mr. K said that if you understood these concepts, then you understood the lesson for today.
So equipped with our new found knowledge we set off to graph these things called reciprocals. To do this we started off as follows.
"Taking the graph of x+2, graph 1/f(x)"
At first, these appeared to be a daunting task, I mean, telling someone the reciprocal was one thing, but graphing it? A whole 'nother matter indeed. However Mr. K once again came to our rescue and showed us a couple of steps to aid us in our reciprocal graphing woes.
Step.1) Graph the original function.
- Now this may seem like kind of a no-brainer, but in the second example we received we saw that we would not always be giving the original function first, and would have to figure out what it was first, THEN graph it, THEN move on to the next step.
Step.2) Find every point on the original graph where y= ±1.
- This step is necessary because as we found in our numbers (shown above starting with 1 and ending with 1 000 000) the reciprocal of 1 is always 1, and the reciprocal of -1 is always -1. THUS, these points will always be on the reciprocal graphs. *note* These points are called Invariant Points
*Vocabulary Skill + 5!*
Step 3.) Look at where your original graph has roots.
-This step is necessary because where ever your original graph has roots, the reciprocal graph will have an asymptote, due to the fact that the reciprocal of 0 is undefined.
Step 4.) Now the final piece of the puzzle, putting it all together and drawing/sketching out the reciprocal graph. To do this, we must simply follow what we found out before about reciprocals. When the original value is biggering, the reciprocal value is smallering. Keeping this in mind, we may begin construction of the line. To do this, look at the line of the graph, and see which direction it's going. For example, looking at the graph of X+2, and it's reciprocal, 1/X+2
Click here for the graph!
So looking at the graph you should notice the two green dots. Those are out invariant points, and it is from these that we will be working. Since it's normally a good idea to start with the extremes and work from there, that's what we'll be doing today.
*note* when doing these, you'll determine the graph direction by going towards the asymptotes. This may make more sense in a moment.
So starting at the point (-1,1) and working towards the asymptote, we find the graph smallering. Thus by our "mantra" so to speak, we know that the reciprocal graph line, must be biggering. Thus we draw our first point. Next we go to the other extreme, at the point (-3, -1). here, the graphs behaviour towards the asymptote is to smaller negatively (which is technically biggering.) Thus, the reciprocal line graph must bigger negatively (which is thus smallering.) Finally we are left to do the final lines, those not seen on the extremes, the ones curving up vertically, near the asymptote. Much like the previous ones, the solution lies in the biggering and smallering, using the invariant points as our start point. Looking at the graph from the green point and going towards the asymptote, we see that it is still smallering, and thus the reciprocal line much be biggering, this time, up the y axis. The same is true for the other point, except it is biggering negatively, as it is in "quad 3" and thus negative in value.
I think this for the most part concludes this blog entry. There is one more thing though, as we put together another graph in our examples.
Click Here for the Second Graph!
Plotting the reciprocal graph for this function was the same as the other, except there were two asymptotes instead of one. Following the steps you may eventually come to a point where your wondering what to do with the vertex of this graph. Because it is a y intercept, you can figure out where it will be on the y-axis in the reciprocal graph (in this case the y intercept is at -4, so the reciprocal point is at -1/4) Since this is a smooth graph, all that remains to be done is join the point at (0, -1/4) to the rest of the graph. In the image above, this step is colored in orange (sorry if it's hard to see). So yes, the part everyone usually scrolls down the whole thing to see, whose the next scribe -_-;
Alright, I believe that really and truly raps it up for today.Again I'm sorry the blog came out late, and maybe slightly all over the place. Hopefully its understandable, cause this is basically how I interpreted the lesson, and I've been told my way of doing things is a little bit weird at times :p If anyone has any questions about my post, or needs me to clarify something, feel free to post it. Also if anyone has anything to add, or knows I forgot something, feel free to tell me (and PLEASE DO TELL ME) so that I can fix it, or add it in or whatever. Also on the flip side if you feel so inclined you can add it in yourself :p
Well since I'm too tired to make a big huge crazy skill testing question to decipher to find out who the next scribe is, I'll probably just come out and tell you it's Richard. Kinda like how I just did...
OH also, homework was exercise #10, for anyone who missed that.
One more thing, don't forget about Mr.K lying during class :p It seems to me we've forgotten about it already! Lets be sure to catch him in the act tomorrow eh? :D
Finally, the word you've all been waiting for.
http://www.merriam-webster.com/dictionary/infinitesimally
REMEMBER! When A number is biggering, it's reciprocal is smallering!
Monday, March 3, 2008
Odd, Even, and Inverses
Hi its me benofschool and here is today's scribe. Let's begin.
We started off with reviewing what an odd and even function was. An even function is a function that is symmetrical across the y-axis as explained in the 2nd slide of the slide show. An odd function is a function that is symmetrical about the origin. For example if a coordinate found on a function is (2,3) then the odd coordinate of the odd function would be the opposite sign for the x and y coordinate which would be (-2,-3).
Next we learned to find out if a function is even, odd, or neither. To find the even function, take the given function and make f(x) into f(-x). Look at the first question on the 4th slide of the slide titled March 4. To see if the function was even make it f(-x) which makes all x values negative. Then simplify. If the result was the same as the original function then it is even.
For an odd function start off the same way as the even function procedure and if it is not equal to the original function then make f(x) into -f(x). That means put the original function in brackets and multiply it by negative 1. Then if it is equal to f(-x) it is odd. But if it was not equal to it then it is neither.
In symbolic format for an even function: f(x)=f(-x). For an odd function: f(-x)==f(x).
For the 5th slide we had to find the odd of the function in the 1st quadrant. To find it we had to get the main points on the graph and find the odd equivalents of them:

Now we began inverse functions. One anecdote would be a baby invading a clean room makes a messy room. That would be the original function. An inverse function would be a function that undoes what the original function did so the inverse of the baby play would be the parents go into the messy room and makes it clean again. You can see it visually in the 7th slide.
In mathematical talk. The Inverse of a function undoes what the original does. The domain of a function is the range of the inverse while the range of the function is the domain of the inverse function. Symbolically: (a,b) ---> (b,a).
If you were wondering why I was stating different things in different ways like symbolically and graphically which are all the same block of wood. A block of wood is Mr.K's favourite teaching tool. It shows that a function or a graph can be expressed in 3 different ways: graphically, symbolically, numerically; in some cases verbally.
Back to the class. We were then told to find the inverse of a function. If a function was y=f(x) then to find the inverse we switch the variables: x=f(y). But we, smarter than the average bear (Mr.K's famous sayings), must solve for y like in the 8th slide. y=f(x) ---> x=f(y).
We can then look at it conceptually (same block of wood) which is found of the 8th slide on the T-chart. We showed what x went through to equal y so the inverse does the opposite in the reverse direction shown on the slide.
Okay lets graphicall look at all of this madness. Lets take a look at the final slide. The graph of f(x)=x^3. The axis of symmetry is y=x. so if we could fold the graph along the axis of symmetry it would also become the inverse. Or if we switched the x values with y values and vice versa we get the inverse function.
That was all for today and unfortunately it was only one period long so we couldn't complete that last question on the board so hopefully that will be tomorrow. So homework is the exercise #9 and to find a site that has to do with circular functions and Delicious it with the tags: pc40sw08, the unit, and preferably your blog name.
The next scribe will be Hi I'm Justus.
Bai Bai
We started off with reviewing what an odd and even function was. An even function is a function that is symmetrical across the y-axis as explained in the 2nd slide of the slide show. An odd function is a function that is symmetrical about the origin. For example if a coordinate found on a function is (2,3) then the odd coordinate of the odd function would be the opposite sign for the x and y coordinate which would be (-2,-3).

Next we learned to find out if a function is even, odd, or neither. To find the even function, take the given function and make f(x) into f(-x). Look at the first question on the 4th slide of the slide titled March 4. To see if the function was even make it f(-x) which makes all x values negative. Then simplify. If the result was the same as the original function then it is even.
For an odd function start off the same way as the even function procedure and if it is not equal to the original function then make f(x) into -f(x). That means put the original function in brackets and multiply it by negative 1. Then if it is equal to f(-x) it is odd. But if it was not equal to it then it is neither.
In symbolic format for an even function: f(x)=f(-x). For an odd function: f(-x)==f(x).
For the 5th slide we had to find the odd of the function in the 1st quadrant. To find it we had to get the main points on the graph and find the odd equivalents of them:

Now we began inverse functions. One anecdote would be a baby invading a clean room makes a messy room. That would be the original function. An inverse function would be a function that undoes what the original function did so the inverse of the baby play would be the parents go into the messy room and makes it clean again. You can see it visually in the 7th slide.
In mathematical talk. The Inverse of a function undoes what the original does. The domain of a function is the range of the inverse while the range of the function is the domain of the inverse function. Symbolically: (a,b) ---> (b,a).
If you were wondering why I was stating different things in different ways like symbolically and graphically which are all the same block of wood. A block of wood is Mr.K's favourite teaching tool. It shows that a function or a graph can be expressed in 3 different ways: graphically, symbolically, numerically; in some cases verbally.
Back to the class. We were then told to find the inverse of a function. If a function was y=f(x) then to find the inverse we switch the variables: x=f(y). But we, smarter than the average bear (Mr.K's famous sayings), must solve for y like in the 8th slide. y=f(x) ---> x=f(y).
We can then look at it conceptually (same block of wood) which is found of the 8th slide on the T-chart. We showed what x went through to equal y so the inverse does the opposite in the reverse direction shown on the slide.
Okay lets graphicall look at all of this madness. Lets take a look at the final slide. The graph of f(x)=x^3. The axis of symmetry is y=x. so if we could fold the graph along the axis of symmetry it would also become the inverse. Or if we switched the x values with y values and vice versa we get the inverse function.
That was all for today and unfortunately it was only one period long so we couldn't complete that last question on the board so hopefully that will be tomorrow. So homework is the exercise #9 and to find a site that has to do with circular functions and Delicious it with the tags: pc40sw08, the unit, and preferably your blog name.
The next scribe will be Hi I'm Justus.
Bai Bai
Subscribe to:
Posts (Atom)