Hello, this is Paul, posting his Blogging on Blogging post.
For this unit, Transformations, we covered a wide variety of topics that relate to graphing. Most of these were pretty simple, like DABC and flips, shifts and stretches. However, for me atleast, I find the questions involving inverses to be confusing most of the time despite how the answer is fairly simple. Also, Im still not really getting how to graph the 1/f(x) questions, although I understand what is being said I can't seem to apply it myself. The question we did in place of the test also helped me alot in understanding how to solve "asin[b(x-c)]+d" questions, which I did not fully know how to solve before. Now I can solve one with a calculator and some paper, yay. Thanks Mr.K.
So in summary, difficult things are:
Graphing 1/f(x) functions. I think my problem here is that Im still looking at the graph as points and then trying to apply the "1/f(x)" (which was our approach for graphing "asin[b(x-c)]+d"), which means I end up with points but not a proper graph. I should definitely review the scribe post for that class before the test.
Inverses are just a little confusing, but I do understand what they do and mean. Probably the hardest part for me is graphing one because Im not totally sure about how to, but a look over that scribe post will probably help.
Other than that I think I understand this unit, or I understand well enough to pass this test (hopefully).
I also would like to apologize to Lawrence and Nelsa that I did not post our group's solution in time. I unfortunately did not anticipate that my alarm clock would not wake me up. Due to my alarm clock being off, I did not wake up until nearly 3pm. Much thanks to Lawrence for posting our solution.
So good luck guys, and don't forget to bring delicious pie!
Showing posts with label Transformations. Show all posts
Showing posts with label Transformations. Show all posts
Thursday, March 13, 2008
Group Second to None
Okay, late I know, but unfortunately our group didn't post in time, So I'll try to do this quick fast.
Anyways, this is our solution.
SLIDE 17:
This equation gives the depth of the water, h meters, at an ocean port at any time, t hours during a certain day
h(t) = 2.5 sin[2pi(t - 1.5)/12.4] + 4.3
A) Explain the significance of each number in the equation
II) 12.4 is the Period of the function, which is obtained from parameter B - 2pi/12.4
III) 1.5 - This is parameter C, which is the phase shift, in which this function, the graph shifts to the right 1.5 units/hours.
IV)4.3 - This is parameter D, which is the sinusoidal axis, which shifts the sinusoidal axis up 4.3 metres..
B) What is the minimum depth of the water? When does it occur?

Now, We can go backwards and use that point, but since we can use whichever point, we decided to use the next one, which minimum depth, 1.8 metres, occurs at 10.8 hours.
C) Determine the depth of the water at 9:30 am.
So then we just plug it in.
h(9.5) = 2.5sin[2pi(9.5 - 1.5)/12.4] + 4.3
*t is 9.5 because time ~ 9:30 AM ~ is converted to 9.5 because :30 minutes is .5 hours.*
in which we get... 2.323 metres.
D) Determine one time when the water is 4.0 metres deep.
So then we go something like...
4 = 2.5sin[2pi(t-1.5)/12.4] + 4.3
First we subtracted 4.3 from both sides like so.
-0.3 = 2.5sin[2pi(t-1.5)/12.4]
Then we added the phase shift to both sides to get...
1.2 = 2.5 sin[2pi(t)/12.4]
Then we divided parameter A out.
0.48 = sin[2pi(t)/12.4)
We then divided 2pi/12.4 in which .48 would be multiplied by the reciprocal of 2pi/12.4, and moved sine to the other side to change it to ARCSine to isolate t.
ARCSine(0.9473) = t
Which would equal to --> 1.2447 hours.
To make it efficient, we'll multiply the .2247 by 60 so
Depth of water of 4 metres occurs at 1:13:48 am.
Again, sorry for posting so late. Original personnel that was to post, did not post. Feel free to comment, as we are supposed to.
Nothing Less Than The Best....Group
SLIDE 18
On a typical day at an ocean port, the water has a maximum depth of 20 m at 8:00 a.m. The minimum depth of 8 m occurs 6.2 hours later. Assume that the relation between the depth of the water and time is a sinusoidal function.
Let's draw a graph!

a) What is the period of the function?
From the information we have been given...
* We can set the 8am as t = 0 hours.
* A maximum value is when t = 0 hours and when d = 20.
* A minimum value is when t = 6.2 and d = 8.
We can see from the graph that the period is 12.4 hours.
b) Write an equation for the depth of the water at any time, t hours.
cosine equation's parameters...
A = 6
B = (2pi) / 12.4 = pi/6.2
C = 0
D = 14
To get A, amplitude, calculate the distance from the sinusoidal axis to a maximum value or minimum value.
sinusoidal axis = (20+8)/2 = 14
amplitude = 14-8 = 6
B = pi/period = pi/6.2
C, the phase shift, is 0.
D is the sinusoidal axis, 14.
D(t) = 6cos [(pi/6.2)t] + 14
c) Determine the depth of the water at 10:00 a.m.
10:00 am = 2 hrs from when t = 0 or 8:00 am. Plug in the 2 as t into the equation to get the answer.
D(2) = 6 cos [(pi/6.4)2] + 14 = 17.1738 metres
d) Determine one time when the water is 10 m deep.
The wave is 10 metres deep, so the qestion is asking for what the time is when D = 10. Plug in 10 as D, then solve for t.
10 = 6cos[(pi/6.2)t] +14
-4 = 6cos[(pi/6.2)t]
-4/6 = cos[(pi/6.2)t]
arc cos(-4/6) = (pi/6.2)t
2.3005 = (pi/6.2)t
2.3005/(pi/6.2) = t
2.3005 x 6.2/pi = t
14.2632/pi = t
t = 4.5401
Convert the 4.5401 into "actual time" because we use hours:minutes:seconds to show time, so...
4.5401 hrs + 8am = 12.5401 hrs
Obviously, its not efficient to say .5401 hrs so we convert that to minutes.
0.5401 x 60 = 32.406 min.
12:32:24pm
We can round that to 12:30pm.
Trig Assignment team "Jabawakeez"?
So these are the solutions for the question:

Here's how our graph looks like. In the question we were given the max and min values of the wave. The max is at 4:30 and we changed the time to its number value by taking the minutes and dividing it by 60 so its new value was 4.5 on the graph. Now it is easier to add 6.2 hours to it, so the min will be at 10.7 on the x axis. With the max and min we can figure out 1/2 of the period. Since the min and max are 6.2 hours apart we use that. 6.2 * 2 = 12.4. But here's the tricky part. If you do 12.4*(1/4) it will not equal 4.5. So we can't do the 1,2,3,4 ticks and automatically write in the values. What we did was 4.5+12.4 to make it easier to graph. The value in the 4th tick on the x axis is now 16.9. The values on the x axis are now 1/4, 1/2, 3/4 of 16.9. Then you'll just put the points on at the max and min. Then we know the patterns of the curve (after the max) will go to the avg value, then min, avg value again, and then the max.
 a)Here's an equation in cose. To find D we found the average of the min and max which was 5. We can now find parameter a by subtracting 5 from the max 9.6. B=2pi/period so in our equation it'll be 2pi/12. In our graph here it does not start at the max where cosine starts so it must've moved by 4.5 our parameter c.

b) First we changed 2:46pm to its number value. Since it has passed into night time we can add the 12 hours from the morning. Then all we do is add the 2 hours and 46 minutes. But we divide 46/60 first. So its number value should be 14.7667. We take this value and plug it into t. This can be done on the calculator...and will get an answer of h=7.1641m.

c)In this question we just plugged in 2 into the equation and solved for t.
Tidal forces are greatest when Earth, the sun, and the moon are in line. When this occurs at the Annapolis Tidal Generating Station, the water has a maximum depth of 9.6 m at 4:30 am and a minimum depth of 0.4m 6.2 hours later.
Here's how our graph looks like. In the question we were given the max and min values of the wave. The max is at 4:30 and we changed the time to its number value by taking the minutes and dividing it by 60 so its new value was 4.5 on the graph. Now it is easier to add 6.2 hours to it, so the min will be at 10.7 on the x axis. With the max and min we can figure out 1/2 of the period. Since the min and max are 6.2 hours apart we use that. 6.2 * 2 = 12.4. But here's the tricky part. If you do 12.4*(1/4) it will not equal 4.5. So we can't do the 1,2,3,4 ticks and automatically write in the values. What we did was 4.5+12.4 to make it easier to graph. The value in the 4th tick on the x axis is now 16.9. The values on the x axis are now 1/4, 1/2, 3/4 of 16.9. Then you'll just put the points on at the max and min. Then we know the patterns of the curve (after the max) will go to the avg value, then min, avg value again, and then the max.
a)Here's an equation in cose. To find D we found the average of the min and max which was 5. We can now find parameter a by subtracting 5 from the max 9.6. B=2pi/period so in our equation it'll be 2pi/12. In our graph here it does not start at the max where cosine starts so it must've moved by 4.5 our parameter c.b) First we changed 2:46pm to its number value. Since it has passed into night time we can add the 12 hours from the morning. Then all we do is add the 2 hours and 46 minutes. But we divide 46/60 first. So its number value should be 14.7667. We take this value and plug it into t. This can be done on the calculator...and will get an answer of h=7.1641m.
c)In this question we just plugged in 2 into the equation and solved for t.
Wednesday, March 12, 2008
WORD PROBLEMS...TEAM KA-BLAMO! Problems?? Word, man...
I think it's original to call our fantabulous team of three Team Ka-Blamo [members: Jamie, Kristina and Eleven]
Well, our problem of course, was on slide 15 and it asks:
Well, we're going to do things the old school modern way...actually write the stuff on paper...[because we can't afford a tablet] then scan it and upload...that's the way we do things. We spent like five hours getting everything well, thorough enough via MSN...
A FERRIS WHEEL HAS A RADIUS OF 20 METERS. IT ROTATES ONCE EVERY 40 SECONDS. PASSENGERS GET ON AT POINT S WHICH IS 1 METERS ABOVE GROUND LEVEL. SUPPOSE YOU GET ON AT S AND THE WHEEL STARTS TO ROTATE.
a.] Graph how your height above the ground varies during the first two cycles...
The graph we drew looks pointy but it is CURVED sorry.

That's just a graph based on the given info.... and we nearly got confused because of the minimum value being 1 m off the ground instead of touching the x-axis. But then we figured that ferris WHEELS [typo in your slide.] don't touch the ground or else they would scrape the concrete.
b.] Write an equation that expresses your height as a function of the elapsed time.
Basically, all we did was find each parameter for both the sine and cosine function even though we only needed one.

c.] Determine your height above the ground after 45 seconds.
All that needs to be done here is sub the t in the function H(t) with 45 seconds and the result will be the new height at this time according to the graph, assuming the revolving doesn't stop and is continuous.

d] Determine one time when your height is 35m above the ground.
Replace H(t) with 35 and isolate t to get time in seconds.

That wasn't much explanation in words but you know... we spent a lot of time getting these answers and we hope this is what you guys are looking for....I'm famished. G'night...I'll edit this later....haha
Yet Another Workshop Class
Hello once again, it is I, Kristina, back for another scribe post. Today, we were supposed to have a pre-test in the morning and the actual test in the afternoon but we ended up only having the pre-test in the afternoon. The reason why was because Mr. K thought that we weren't ready to have the test after seeing us somewhat struggle over yesterday's class. So, in the end, we ended up using the morning class to have a workshop period! Yay, fun..
After we had been split into our groups, which there were a total of four, we were given a question to work with. I will type out the question, which is already on slide 2, for your convenience.
At a sea port, the depth of the water, h meters, at time, t hours, during a certain day is given this formula:

A) State the: i) period ii) amplitude iii) phase shift
This was the first part of the question, which should be fairly straight forward. BUT! It ended up not being so straight forward to the class. Every group came to the same conclusion for the amplitude and phase shift, but the class became divided with finding the period. Which is shown in slide 2 with the two different answers.
The first answer (red) is not the right answer, the one in blue is the correct one. This is because the group who put up answer red didn't factor out parameter B correctly. They thought that because since 2pi wasn't "visually" over 12.4, that they had to factor that out first and then multiply 2pi by 12.4 to isolate parameter C. After a bit of arguing and confusion, Mr. K kindly showed us that even though the 2pi didn't appear to be over 12.4, it actually was. The reason for this is because that 2pi could also be seen as 2pi/1, which, when multiplied, actually gives 2pi(t-4.00)/12.4! Now, from there all you need to do to get the period is to factor out the 2pi/12.4 to get parameter B and then to get divide that from 2pi. Voila, you should then get the answer of 12.4. We can then move onto the next question..
B) What is the maximum depth of the water? When does it occur?
Now, for this part of the question, I am going to explain how to do it in a completely different way from what the slide shows you. The reason for this is because, in my own opinion, it doesn't depict a very accurate and understandable way on how to find the actual value. By just using the graph to try and find it, I think its just like guessing, therefore not very accurate. The graph is only good when you want to pinpoint which areas the answer will be in, which is actually shown very nicely on the graph in slide 4.
Well then, to show how to get 7.1 hrs as the answer, I am going to show you how to get it MATHEMATICALLY using the formula!
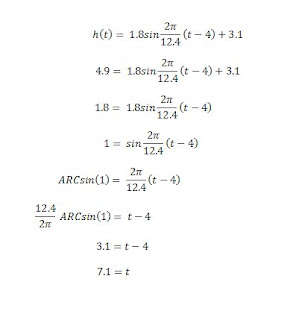 Looks difficult? Nah! Its so simple! You see, all I did was input the max value, which was 4.9 into h(t) . From there, I then solved for t. I'm sure most of you have gotten stuck after getting to the ARCsin part, well then don't fret, because I've also had troubles with that in the past. All you have to do to isolate the (t-4) is to multiply both sides by the reciprocal of 12.4/2pi. When you do this, 2pi/12.4 on the right side will get cancelled out and then you will be left with 12.4/2pi * ARCsin(1) = t - 4. From there's its baby stuff! We're all in pre cal, I don't think you need me to explain what to do from there. Anyways, I hope this solves any problems people had with slide 4. MOVING ON..
C) Determine the depth of water at 5:00 A.M. and at 12:00 noon.
This is simple, all you have to do is input 5 and 12 into the value for t and then solve from there. If you need further explanation for this, feel free to add a comment since I am seriously getting tired right now haha >_<.
D) Determine one time when the water is 2.25 meters deep.
Okay, this is basically the same as letter B. Instead of 4.9, input 2.25. Then solve from there. No further explanations need to be said for how to do these kind of questions. But, in case you do, please leave a comment!
AWWRIIIGHT! Moving onto the afternoon class! First thing we did was have a PRE-TEST! We were given about, I don't know, 20 minutes? to do it and then we were put back into the same groups we were in for the morning class to discuss our answers so that we could hand it in, but only one person's pre-test was handed in.
We then went over the answers after having handed in one person's pre-test. The multiple choice answers were pretty straightforward, so I am going to skip to the very last question since it was definitely the hardest one out of them all.
Starting off with the question "a)" of the last question. Its asked to sketch a graph of the height of the point A above the outflow water level as a function of time starting at t = 0 seconds, with A as shown in the diagram. The first thing you had to do to be able to graph this was to find the period. We were able to get the period from the information in the question that said there were 5 revolutions every 4 minutes. From this info, we can then find the period by attempting to when 1 revolution occurs, which will end up in seconds. As slide 12 shows, the period will be 48 seconds since that is when 1 revolution occurs. The graph can now be made easily and the reason why it starts at 0 is because starting at 0 seconds, point A is still above the outflow.
Part "b)" of the question is pretty self explanatory. All you had to do was take a look at the graph and then find the different parameters for SINE and COSINE. From there, you would be able to get the same answers as shown in the slide if you did it right. As for part "c)", this is just like question "B" from the morning class. Instead, you can choose between which formula you want to work with, either the SINE or the COSINE that you made in the previous question. Once you've done that, just input 4 into h(t) and then solve for "t" in the exact same way as shown in "B" from the morning's question. After having solved for question "c)", you can now solve for question "d)". Take a quick look back at the graph and find where 4 meters would be. If you draw a straight line across, you'd see that it touches two parts of the wave. That is why the answer shows that you have to multiply the answer by 2.
After we had finished going over all the answers, Mr. K then told us that we had a group assignment to do. Each group was given an assignment that was similar to the questions we had done today. They're expected to be posted onto the blog with the appropriate tags: "TrigAssignment, (names of group members), Transformation. The due date is on MARCH 13 BY NOON. Once every group has got their assignment posted, everyone is expected to comment on each of the groups' assignments, excluding their own, whether they be about how neat their work was, or if they found an error, etc.
Now then, I guess that's all for me. REMEMBER GUYS! TOMORROW'S PI DAY! Make sure you don't forget to bring your delicious pies! As for the lucky scribe for Pi Day, I choose....Roxanne. Well then, that's all for me. Oh yeah, and remember! THE TRANSFORMATIONS TEST IS ON FRIDAY AFTERNOON! For those of you who haven't BOB'd yet, be sure to do it by then! Alrighty, now seriously, I'm out.

Tuesday, March 11, 2008
BOB on Transformations!
This is my first BOB before the test.
I found this unit particularly easy, that's ONLY if you were paying attention and reading your notes every night, like what Mr. K had explained you to do. Anyway. I was gone for a class, and every class of Mr. K's class missed hurts. You'll see if you were in my shoes. Especially if the lesson was long and essential. So I had some trouble on translations.
.. The .. y = a f(b(x-c)) + d
Everyone was going "STRETCHES BEFORE TRANSLATIONS"
And I was going "whuuuAAtt?" Or in double-click-other-words .. "What?!"
So I did my homework and went on the blog and caught up, or at least I believe I did.
I found transformations fair. I mean if you listen you should catch on quickly. Maybe a little more or less thinking here and there. The word problems aren't much of a biggie either. I'm confident of knowing my stuff. But not too confident in solving questions. Especially how there are many twists and turns of the question.
Oh right, and in the world problems. What I didn't like or did not understand was finding the time or day for a sunrise or certain time. It just got too confusing. Thanks.
Pre-Transformations Test Review
Hello everyone, it's Nelsa again, writing my second scribe post. Oh and, if anyone's confused, my nickname's Dimple, so uhm, that's that.
Most of this class was a review, since everyone's BOB posts contained uncertainties with graphing reciprocal functions and solving word problems like the one we just learned yesterday. We were placed into groups, and we started by solving the homework that everyone should have attempted for homework. I believe that is on the first four slides, not including the title.. page. Just remember guys, that wherever the function has roots, that's where the asymptote is, and the invariant points are where one and negative one is. Mark these first on your graph, it'll make things easier. From that point on, you just need to remember that whenever the values are smallering, the reciprocal is biggering, and whenever the values are biggering the reciprocals are smallering. Also, pay attention to the end points and arrows on a graph. If you draw an arrow when the graph clearly stops, you'll lose a full mark.
After reviewing our homework, we were given another word problem:
The pedals on a bicycle have a maximum height of 30 cm above the ground and a minimum distance of 8 cm above the ground. Jeng pedals at 20 cycles/minute.
The first question asked us to find the period in seconds. Since there's 20 cycles/minute, with each minute containing 60 seconds, we divided 60 by 20 to get 3 seconds/cycle. We were also asked to write two equations, which means figuring out ABCD. The sinusoidal axis. is the value between the minimum and the maximum (8 and 30), which is 19. The amplitude was found by subtracting 19 from 30, which is 11. The period as we know is 3, which means in the equation, the period is written as 2pi/3. All that was left to figure out was the phase shift, and after some confusions and disagreements, we finally agreed that for the cosine function, there was no phase shift, and for the sine function, the graph shifted to the right by 3/4. We found two equations using the above information.
And that was basically the whole class. Don't forget that we have a pre-test and a test tomorrow, good luck all. The next scribe shall be Kristina. =)
BOB on Transformations, Function in Disguise
Yet again, bobbing, for the next test that is coming. Wow.
Transformations. I understand the whole graphing sine & cosine, so the whole graphing functions wasn't so hard, until it came to more complicated things like 1 / f(x). A key step to remember when graphing the new function is STRETCHES before TRANSLATIONS. ALSO remember to put f(x) = or y = otherwise it will be treated as an expression and will be marked WRONG. And then you'll fail. Well you won't fail but you'll lose a whole mark. So that was pretty good to remember. The whole DABC thing, I believe I got in the bag. So I'm feeling pretty good. I should study anyway though.
Piece wise functions got me in a bind for a bit. I don't completely understand them yet, but I'll look back at them and stare at them for a good few hours and maybe I'll figure something out. The 1/sine stuff I understand now after finding the patterns because well I mean, like Mr.K says, Math is the science of patterns. Therefore, is math a science... or is math.. Math? Anyways, the Sunrise problem was quite an eye opener, but after Mr. K gave us a push-start, I started to see everything fall into place with the exception of missing little things like adding the -10 to the total, which would mess up out marks so, that's something to look out for.
Overall, this unit was pretty good with the few exceptions of a few things that threw me off course but one we stare at it for a bit, we tend to find our way again, right guys?!
My BOB for Transformations
Ahhh yes our second unit... TRANSFORMATIONS. I know what you are thinking: Transformers, sorry but nope....
This is so much better than those silly robots. Unlike the Transformers who are only limited to a few or several forms (Optimus Prime always has the most), you can take a function and transform it in an infinite amount of ways by changing the values of the parameters: A,B,C and D. Anyways... I do not really have any beef for transformations, in fact I sorta enjoyed it. Looking at graphs in four different ways: numerically, graphically, visually and symbolically, my favourite being numerically since that is way I usually think. Carrying on, as I said before, this unit was not really that complex. A few bumps down the road such as reciprocal functions. Biggering...? Smallering...? What happened to the good old terms like increasing and decreasing... That kinda threw me off. Guess I should of read more Dr. Seuss back in my childhood. At first, I did not really get it, but now I do. After those examples we did today, it all became clear. Find the roots, variant points and graph away! Piecewise functions wasn't really a snag but I still don't know what an open circle means... Well that brings my BOB to a close. Can't wait until pi day, the anticipation is boiling within me.
Until next time, LATER
Monday, March 10, 2008
Bob on Transformations
Well i just its time for another test here is the bob on Transformations.
At first i thought that this unit was going to be really tough but as soon as we got in to it, it started to get pretty simply. one thing that i had trouble on was the graphs but toady's class really helped me out. ohh yeah another thing that really confused me at first was the words that we used in class like biggering and smallering, but now i get it. One rule that is key to remember is stretches before translations.
Well today brought up another problem for me. for some odd reason the Saskatchewan problem was a bit confusing but after looking at it for a long time and thinking about it i think that i might get it. Other wise this unit was a pretty good unit for me.
Transformations and BOB.
Francis here with a BOB on transformations. The test is up and coming and I have a feeling it's going to hit full tilt! But I'm not stressing, I'm cool, I'm cool. Just relax, take notes.
I found our unit on transformations quite easy and straight forward, because it's pretty much like a step ladder, take one step at a time and you'll be at the top safe and sound! I just remember to plot STRETCHES before TRANSLATIONS for those tough equations that include just about every type of movement. CONTORTIONIST EQUATIONS! Yeah, I made that up, but it kind of makes sense. Since these graphs seem to stretch and twist and turn and move all about. It's quite scary but I think I got it down.
I still have quite a bit of trouble on reciprocal equations, because it takes a lot of little steps to complete it. First you have to plot the original equation, as a guideline, then include asymptotes and then points that don't change on the reciprocal function and the original function. Finally figure out whether or not your lines are biggering, smallering, biggering negatively or smallering negatively. Probably missed a couple steps, but I guess that's why I'm having trouble on these things!
Well, that's my piece on transformations. Until next time.
Over and out? Under and out? Whatever
-Francis
SCRIBE MANNN SCRIBE. for today
Okaaaaaaaaaaaaaaaaaaaaaaaaaaaaaaaaaaaaaaaaaaaaaaaaaaaaaaaaaaaaaaaaaaaaaaaaaaaaaaaaaaay. So I guess I am the blogger today! Or scribe. Whatever. So ! Today! .. Is 4 days away from Pi day! Alright, cool.
Alright we started off class ready to learn. Although we couldn't because our fingers were frozen. Except Rguy204, he was Rence's hero, because he had a shirt on, and he was perfectly fine. Practically sleeping. Gosh he should be living in the North Pole. Kidding, anyways.
Instead of starting off continuing the Saskatchewan Sunrise Problem, Mr. K decided to help the class get more familiar with transformation questions. Which I thought was really helpful and should do it more often in every unit. *HINT HINT* COUGH COUGH. I HOPE YOU READ THIS MAN. IT'S IN CAPS LOCK. Thanks, if you do. Cheers.
IN SLIDE 2 .. Yes that is my awesome super flashy graph that everyone loves. With some sprinkles on the side. This is the graph of y = |2-x| .. Absolute values cannot be negative. If you had a table of values, the Y coordinates go down to 0 then go up. 2-x has a negative slope, when it reaches 0, values of Y go positive, thus creating the graph you see on the slide.
SLIDE 3 .. I did this one also. Unfortunately, it's not so awesome. Sorry fans.
y = 1 / x^2 + 1
This graph has a history behind it. Although I'm too lazy to explain it, but it's also known as the which. Click Here, it's a link of a wikipedia about it.
Anyways, now for the explaination.
SORRY.. but the red line of the parabola is SUPPOSED to be dotted.
Then you must find where Y = 1 and -1 .. Because the parabola is biggering, the recriprical must be smallering. The curve towards the x axis is more smooth. Remember it gets infinitely big and never touches.
SLIDE 4 .. Good job BenOfSchool! (the red) but he made a minor mistake that a very mean mean mean mean mean green mean person had to find. (the blue)
y = |f(x)|
because the y value cannot be negative, because of absolute values, it is flipped onto the positive side, thus creating that bird looking graph.
It's not as beautiful as I would have graphed it though. But cheers, because ya'll dig.
SLIDE 5 .. WOO HOO! Go me! Look how nice that graph is! Check out those curves. OhhH dayum! Yes, anyways this graph is a tricky one.
y = 1 / f(x) ..
As you can see the right side of the graph has a stopping point (5, 2), and the bottom is continuously going to the left. Good to know! (Sorry for my poor math language here Mr. K)
To being graphing the recriprical of this function you find where y = 1 and -1
Those are the invariant points
Then you find the roots ( asymptotes )
In this case (-2,0)
From point (-3, -1) to (-2,0) f(x) is smallering negatively, thus the recriprical is biggering negatively.
The recriprical of 2 is 1/2 which 1/f(x) lines negatively to the left on -1/2 ..
As for the other curve, it curves infinitely big, biggering negatively.
from (-2,0) to (-1,1) f(x) is smallering, thus 1/f(x) is biggering, the line curves up infinitely.
As for the other, it lines positively to the right and stops at point (5,1/2)
OH GOD. I HAVE NO CLUE WHY MR. K HAS 21 SLIDES TODAY.
.. what did I ever do to you man ..
SLIDE 6 & 7 are familiar, so I'll explain them both. Everyone in class knows how a sin graph looks like ( sin(x) to be exact ) .. and so there are 4 asymptotes ( or roots ) in between of those asymptotes there is a wave to relate to.
In slide 7 you see the first wave on the left, it starts from 0, reaches it's maximum then goes back to zero. It may look like a parabola, but it starts from the wave's maximum then curves up and towards the asymptote, but never touches.
Mr k, you're a great artist by the way. (extra marks!)
-slide 8 is a must see
-------
So we continue our problem solving on Saskatchewan Sunrise Problem
we all agree that 3.25 is 3:15 Am, because 25 is a quarter of 100, which is 15 to 60. Yes? good.
ON SLIDE 10 you see all the calculations and setups done.
Now we move on to slide 11.
Why did we start the graph with -10?
Because Dec 21 is 10 days before January.
Dec21 to Jan21 is 172 days.
Why is the minumum 3.25 and maximum 9.25?
because 3:15am is the earliest sunrise and 9:15am is the latest sunrise
Now how can we find A, B, C, and D?
To find D ( vertical shift )
We simply did this ..
(3.25 + 9.25 / 2) which gave us ..
6.25
To find A ( amplitude)
we simply did this ..
(9.25 - 6.25) which gave us ..
3
To find B ( period )
We simply did this ..
We did some thinking. 172 is half the period.
but because we started off at -10, half the period is 182.
KEEP THAT IN MIND.
182 x 2 = 384
So parameter b is 2Pi/364
To find the others, we found a quarter of 364.
Which is 91 days.
To imply that on the graph, we subracted 10, because we started on -10.
-10, 81, 172, 263, 354
IN SLIDE 12
we wrote the equations of the graph in sin and cosine.
SLIDE 13
predict what time it'll be on April 6 using one of the equations.
We simply added up all the days from jan to april 6,
which is 96 days.
Then we replaced all (d) with 96.
We came to a time of 5:28:55 am
SLIDE 14
Simply look at parameter D.
SLIDE 15
as you can see, we inserted 7 on the y axis.
(RUSHING, GETTING SLEEPY)
we then let theta = 2Pi/364(d + 10)
-0.25 = sinTheta
Negative! So we know the answer will be in Quadrants 3 and 4
ARC sin(-0.25) = Theta
-0.2529 = Theta
Now we input it to find out d
-0.2529 = 2Pi/364(d+10)
we multiply both sides with 364/2Pi
which became
-14.6384 = d-81
66.3616 = d
J 31
F 28
= 59
66 - 69 = 7
March 7
To find the Quadrant 3 answer we took Pi and added -0.2529
Which gave us ..
3.3945
Then we did the same process to find which month and day.
(SLIDE 17)
277.6384 = d
278 = d
278-273=5
October 5
THAT'S ALL FOR NOW FOLKS! APOLOGIES FOR THE LATE POST. PRE-TEST TOMORROW. TEST ON WEDNESDAY. PI DAY FRIDAY.
THE NEXT BLOGGER IS. DIMPLE.
BOB Loves Transform(ers)ations!
Well I'm back, this time for the periodic posting of the BOB's (who is that guy anyways?)
SO, transformations. For the most part I found this unit fairly straightforward and easy, mostly due to the fact that I remembered a lot of the steps to solving functions that had been transformed from last year. I thought many of the methods Mr. K taught worked well, and were thus, effective.
One of the things I did have a bit of a problem with initially was dealing with with graphing reciprocal graphs but I figured a lot of it out when I had to do the scribe post for that specific lesson :P
The only thing I'm actually still trying to get a better grasp of is, solving algebraically, inverse functions (eg. given f(x) = x+9 what is the arc f(x)?) I haven't quite got the whole process involved in changing a function to its inverse in an algebraic form. Graphically I don't have any issues but when its just the equation involved I need some help (so if anyone has any tips they use that they could tell me that'd be great :D)
Well I think that about sums it up. Transformations seemed to be kinda a down shift for me, from our previous unit, which I struggled with grasping in the beginning. I'm doing well now that I've finally gotten used to having math again, and am feeling pretty confident going into the pre-test tomorrow :)
Anyways I've got English homework now, so I'm off!
Ciao!
BOB: Transformations
Yet again, there is another test coming up and therefore I am BOBBING! I seem to be real happy, maybe perhaps I just finished my English essay! YAY! However, that has nothing to do with math so here I go with my Bobbing...
I believe the first part of the unit was much easier, mainly because all I have to remember is STRECHES before TRANSLATIONS then I'm good to go! Truth be told, I have an easier time dealing with streching and compressing graphs than finding the reciporcal of a function. I also found that it was easy to figure out whether or not a function is even or odd. I did have some trouble with the aboslute value questions but with the help of the excercies I believe I got the hang of it. (I hope didn't jynx myself)
With that said, the most difficulty I had was graphing reciporcal functions. It's so confusing! Sometimes it takes longer for me to figure it out. Also, in today's class was quite confusing about the Saskatchewan sunrise problem. Oh my god, t'was hard! I still don't really quite understand all of it. I usually have to look over the slides and my notes over and over until I fully understand the whole ball of wax! (Some Mr. K for y'all LOL) I believe the hardest was the last part of the question, well maybe not the hardest, but the most confusing.
With that said, hopefully I will do well this coming test because I think I didn't do very well in the last test. Anyways... goodluck to everyone on Wednesday and on the Pretest thingy! Ciao
BOB For Transformations
Yaaayy test time. You know what that means, it's time for another BOB!
This was a pretty short unit, and it focused mainly on graphing all these functions. Graphing is probably my weakest point for well, everything really, but math in particular. So I found it hard to wrap my head around it for a while. But the more I did it, the more I realized how simple it was as long as you understood the concept. Like the biggering/smallering thing for example. I'm still a little iffy with graphing reciprocals and inverses and the like, but the class we had today to practice helped.
I understood the algebra the best, especially with figuring out if a function is odd or even, I just work better when I see everything laid out in front of me, and if I work in steps.. if that makes sense. So I found that easy to understand.
Soo uhhm, I suppose that is all. Good luck on the pre-test and test everyone. =)
Sunday, March 9, 2008
BOB for Transformations
It's time for another test. It was a short unit but I liked a lot of the things we learned. I feel really comfortable with those asymptote questions. At first that whole biggering smallering thing confused me but I get that now. I've been enjoying those inverse questions too. It really helped that we were showed how to understand them graphically, algebraicllay, and that baby play concept. What I liked best from those three was the algebraic one. It was so simple to get since all we had to do was replace the x and y places. But graphically helped me understand what was happening as a result of the x and y place changes.
What I had some trouble with in the beginning was some transformations. After getting it through my head that -f(x) meant to take the opposite of the y values and that f(-x) meant to take the opposite of the x values it became easy. The whole reciprocal thing confused me too in the beginning. I didn't understand that all we were doing was undoing everything that was done until like near the end of class. One last thing, I'm also really sloppy when it comes to questions like -3f(1/2x-2)+1. I always forget to factor out the 1/2 and to use its reciprocal.
K there's my Bob for this unit. I'm kinda looking forward to this test too. Hope I'll do better on it than the last one where I like blanked out. Anywhooo that's all lol.
Subscribe to:
Posts (Atom)

